Often EQuIS clients need to produce reports with a custom layout and design, which will later be used as a .pdf or printed hard copy. This layout might include, but is not limited to, a corporate logo, page numbering or standard headers and footers. Active Reports is third party application that has been built into the EQuIS Professional application to allow users to design their own reports. In this exercise, we will use Active Reports Report Designer in EQuIS Professional to generate a standard EQuIS report.
1.Determine from where in the database you want to have the information pulled. For this exercise, water level information and well construction information will be used.
a.Water level information (Well ID, Date of Gauging, Northing, Easting, and the Depth to Groundwater fields) are included in the Water Levels (Most Recent) Report.
b.In addition, well construction information can be taken from the view VW_WELL.
Note: The Active Reports Report Designer tool can use more than data tables to create a customized report. Consider EQuIS standard reports, views and functions when assessing where the output of your report will be obtained. |
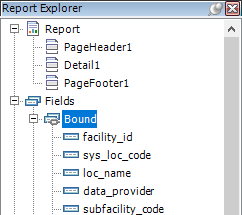
2.After reviewing the information to incorporate in your report, click Active Reports. The Report Explorer section on the right-hand side of the Report Designer window shows all of the report details.
3.In Report Explorer, expand the Fields and then the Bound node.

4.Populate the Active Reports Source Data to join fields from VW_WELL with the Water Levels (Most Recent) Report code:
a.Select the Data Source drop-down arrow from the toolbar.
b.Select Database Reports from the node on the left.

Note: All of the code for the Standard EQuIS Database Reports is available using the Data Source menu in Active Reports. Populating Active Reports with a Data Source database report using this method will also allow users to utilize that report’s screen prompts, which are already built within these reports. |
c. Double-click on Water Levels (Most Recent).
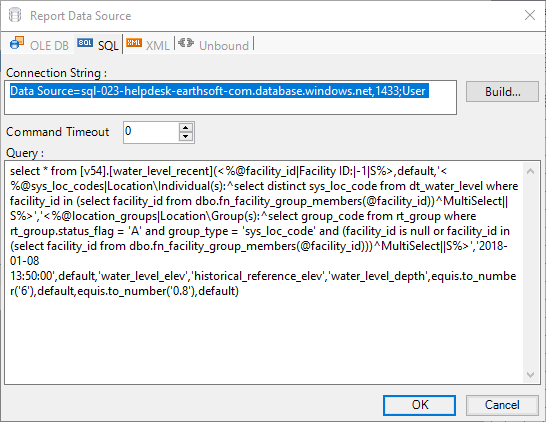
d. The filled Report Data Source window will open and show the code for the Water Levels (Most Recent) Report.

Note: For security reasons, Application Level Security (ALS) users will not have access to the Report Data Source window. |
e. Click OK.
The Bound fields in the Report Explorer window change to reflect this selection, and now represent all of the fields that are available in the Water Levels (Most Recent) Report.