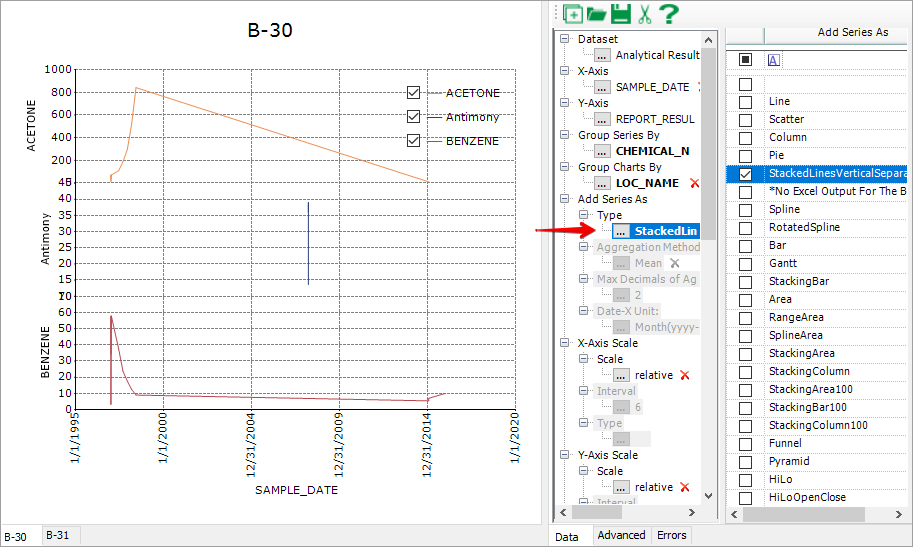
XY Charts can generate a chart of stacked lines that are separated vertically against the results of a report (e.g. Analytical Results or ARII Report) with a date type column (e.g. sample_date of ARII Report) being as X-axis. It plots the lines of each series determined by the Group Series By parameter in one chart, with the lines separated vertically. The example below illustrates how to generate a chart of stacked lines that are separated vertically.
1.Run ARII with ACETONE, Antimony and Benzene (or other analytes you know) at B-30 and B-31 locations and start XY Chart.
2.Select Group Series By = chemical_name, Group Charts By = loc_name, Add Series As = StackedLinesVerticalSeparation, and then click Add Series to create charts (Figure 1).

Figure 1
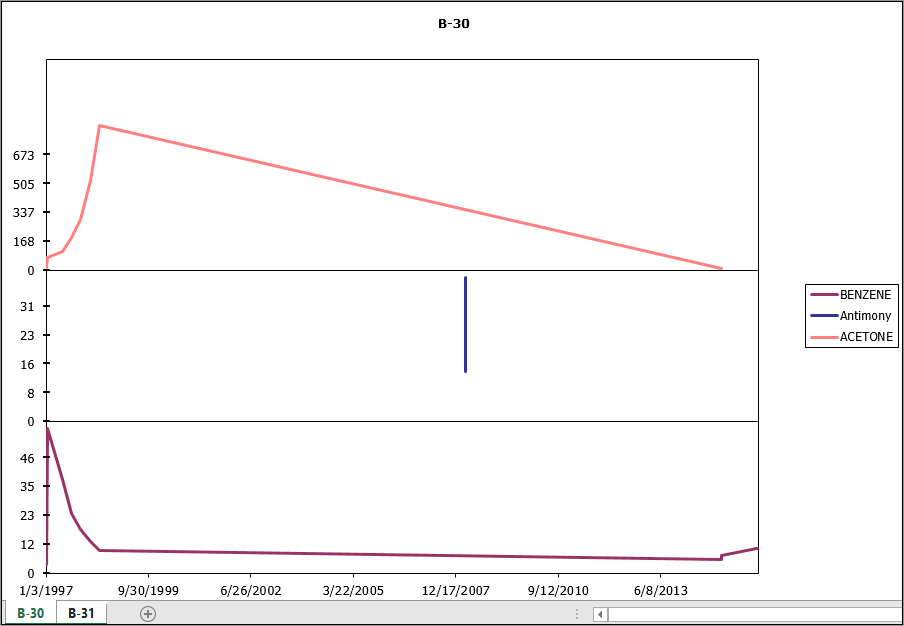
Note: Charts can be exported to Excel. When a prompt is shown to enter a file name during the export, select "Save as type" as .xls so the legends of the chart will display correctly. The stacked lines are drawn in a specially customized method in Excel (Figure 2). |

Figure 2